

We have all heard people comment that Closers™do worse in non-save situations. Is it actually true? How true is it? Here’s a little off-day exercise to explore this phenomenon.
The Data
First, we have to pick Closers™. (OK… this trademark thing is going to get old really soon… so I’ll stop) The methodology here is fairly simple. For each year, I picked the player on each team who had the most saves. This method is simple, even though it leaves off closers who got hurt, some closers who were traded in midseason and includes some guys who through some combination of circumstances ended up leading a team in saves even though they were only used as closers for a small part of the year.
Second, I use the time period 2000-2022. There’s no particular reason to restrict the data like this, but it helps adjust for any trends in closer usage by ignoring earlier periods.
This leaves me with a dataset of 707 pitcher-seasons.(30 x 23 = 690, but there were 17 team-seasons with ties for most saves.
Now I need to split all the appearances by each of these pitchers into save and non-save situations. I didn’t do that exactly. Instead I define a Save situation as coming into a game in the 7th inning or later with the team either ahead by 3 or fewer runs or tied. I think of the situation of coming into a tied game as at least as important as save opportunities and this also covers the situation where a team at home can use its best reliever late in the 9th or later as a pseudosave opportunity. All other situations are deemed Non-Save: the pitcher’s team is either ahead by more than three runs or behind, or the entry is in the 6th inning or earlier. (Note I will actually miss a few other save opportunities when there are men on base and a team leads by 4 or more, but keeping track of those was not worth the effort.)
Finally, I need a metric of pitching performance in these two situations: I use both Fielding Independent Pitching (FIP) and Walks and Hits per Inning Pitched (WHIP). I don’t use ERA because it’s a pain to calculate and has no more information that FIP and WHIP. I use both FIP and WHIP because they are different and both relevant. (For those who aren’t used to FIP, it’s calibrated to be like ERA. So a 4 is somewhere around average and a 1.5 is really, really good.) A guy can have a good FIP as long as he doesn’t give up homers and doesn’t walk anybody, and a guy can have a good WHIP and give up a homer in every appearance. Neither of these is particularly likely over a whole season, but both are a sign in any particular game of an ineffective pitcher. In practice they don’t make a lot of difference, but by including both analyses I avoid the obvious objections to each alone.
I said I had 707 pitcher-seasons, but I really only have 706. That’s because there was one closer who was never used in a non-save situation in one season. (Remember my idiosyncratic definition of non-save situation excludes coming in in a tie game.) That was Jason Grilli of the 2015 Braves. Before his season-ending injury on July 11th, he was only used in Save situations, the only time that has happened in the last 23 years to any player who led his team in Saves, even including the shortened 2020 season.
Analysis
So let’s look at the data. The two graphs plot, for each pitcher, their FIP and WHIP in Save and Non-save situations. I draw in the 45 degree line in which the two are equal. So points below the line on both charts show when the pitcher did better in Save versus non-Save situations, while points above the line are when the pitcher performed better in nonSave situations.
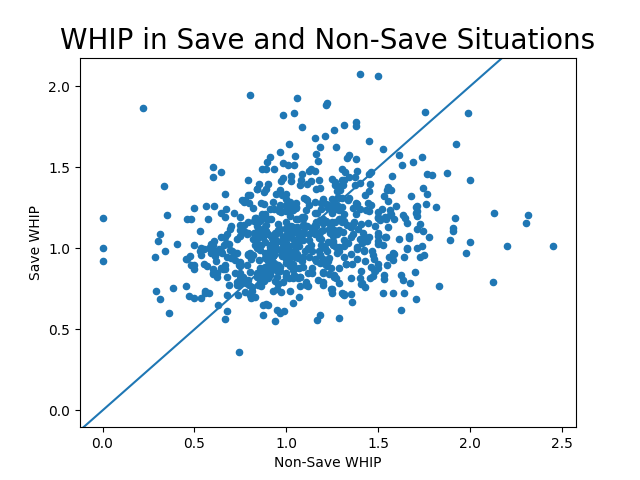

I think it’s fair to say by eyeballing these charts that, on average, a typical closer performs slightly better in save situations (more so in FIP than WHIP) but the effect is small and there are tons of exceptions.
While we’re eyeballing the FIP chart, what the heck is that point way out on the right ? That is Craig Kimbrel’s horrific 2019 season with the Cubs. He was really bad as a closer (even though he led the Cubs in saves) but he also pitched 2 1/3 really bad innings in a non-Save situations. Now obviously 2 1/3 innings is a really small sample size and you shouldn’t take it too seriously, but it does raise an obvious objection to the whole study – aren’t all closers used a lot less in non-Save situations? So shouldn’t small sample size problems make the whole exercise meaningless?
The short answer is no. First, while closers almost always have more innings in save than non-save situations (that’s what makes them closers) most of them have a substantial number of innings in non-save situations. The average closer worked 45 save situation innings and 19 non-Save situation innings, so the Kimbrel and Grilli cases are more the exception (and both of them had less than a full season of work.) So the non-Save situations should be less accurate, but not unreasonably so.
Second, by looking across pitcher seasons, the small sample sizes don’t bias the study, they just make the results more noisy.
Anecdotes
So let’s look at the top 10 and bottom 10 by both FIP and WHIP. Here are the 10 guys with the biggest discrepancies in each direction:

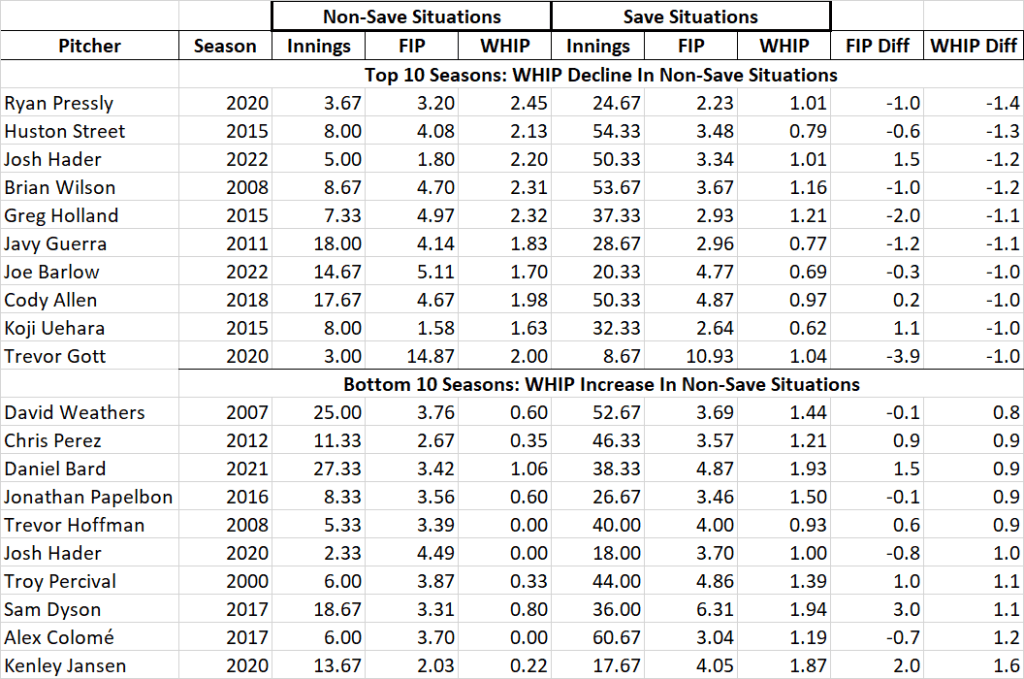
[Note: As I was editing this piece I noticed that I was inconsistent in these two tables in my use of the words “Decline” and “Increase.” That’s because an increase in FIP or WHIP is a decline in performance and I got confused about which one I meant. But since I’m too lazy to go back and recreate the tables (and I’m too incompetent to have stored them), I can just explain that the top of each table is where the stereotype is fulfiiled: worse performance in non-save situations and the bottom of each table is where the opposite of the stereotype is observed: better performance in non-save situations. If you just look at the tables that should be obvious. it should also be obvious that my word choice was infelicitous in the headings and that I’m really, really lazy.]
The WHIP leader was Ryan Pressly’s 2020 with Houston. His WHIP in save situations was fine, but the 3 2/3 non-save innings were terrible. Now of course 2020 was a weird season, but there are other guys who exhibited similar declines in non-save situations with a lot more data, like the 2022 Josh Hader. That said, the outlying performances here all consist of guys with relatively few non-save opportunities.
The bottom 10 are more interesting. David Weathers in 2007 had a fairly pedestrian (for an elite closer) 1.44 WHIP in 52 2/3 innings. But in his no-save opportunities he pitched to an outstanding 0.60 WHIP in 25 innings. He was nuch better in non-save situations while still earning 33 saves for the Reds.
But the other surprising thing (at least to me) is just how close these values are to one another. After all, we have 707 pitcher-seasons, and only 15 had a WHIP differential over 1. 10 of these favored the Save situation, but 5 favored the non-save situation. Now a difference of 1 is a pretty enormous WHIP differemce, but the tiny sample sizes could have led to much bigger differences if there were really big psychological differences between closing and not closing.
The FIP numbers are similar. With the exception of Trevor Gott’s bizarre 2020 (and he “led” the Giants with 4 saves) all of these guys were good closers who were pretty good in non-save situations, just not at their saving levels.
A Little More Math
So now let’s quantify the size of the effect rather than just eyeballing it. I fit two simple linear regressions to the FIP and WHIP analysis. Here are the results:
Non-Save FIP = 1.53 + 0.55 Save FIP
Non-Save WHIP = 0.77 + 0.31 Save WHIP
I’m not going to firehose you with a bunch of fit statistics; and there is no null hypothesis testing here, or even confidence intervals.* Instead, I’ll just tell you that these results are accurate but noisy. [A statistical footnote follows at the end on this point.] The effects are pretty well estimated on average but will be pretty dicey in any given prediction.
But what do these estimates mean? I’m going to try and convince you that this result is interesting, though I’m ready to fail.
Let’s start with the FIP equation: The form implies that anyone with a FIP < 3.4 is indeed expected to perform less well in non-save situations versus save situations. But when you get close to a 3.4 FIP in save situations, the effect is very small. Now when we look at this set of pitchers (and remember: closers are by and large better than most pitchers) we see that the average FIP of these pitchers is right at 3.4, so we would expect about half of them to have better FIPs in non-save situations and half to be worse. But the ones we expect to have worse FIPs in non-save situations are the better closers.
The same is true of the WHIP equation: the WHIP crossover point, after which pitchers are expected to have better records in non-save situations, is 1.1. The mean in this dataset is just under 1.1. Again, it’s the better pitchers who are expected to have worse records in non-save situations.
So if this is a 50-50 phenomenon (FIP) or a near 50-50 phenomenon (WHIP) why has it taken hold on our imaginations? I think the simple reason is that we just don’t notice when a lower-tier reliever does better in non-save situations because we never had that high an expectation for the closer in the first place.
Now the somewhat controversial part of this: some of this might well be the psychological factor that people think about when they make this observation, but a lot of it is undoubtedly regression to the mean. Every pitcher’s season is a combination of luck and skill. Given the relatively small number of innings closers pitch, there is no reason to expect luck to balance out very well. So a lot of good performance by great relievers in a particular year is luck. That doesn’t mean they aren’t good… maybe very good. But great performances in save situations are very likely to contain a lot of positive luck which won’t carry over to non-save situations. Thus, their expected performance in non-save situations is worse than their performance in save situations.
The same works for bad luck. Pitchers with relatively poor performances (so long as it is good enough to keep their jobs) in save situations will be expected to perform better in non-save situations. Again, their bad luck isn’t expected to repeat.

If you’re skeptical (or confused) maybe this will help. Take Mariano Rivera: he has 13 observations in this database, leading the Yankees in saves every year from 2000-2013 except for his injury year in 2012. His best two years for save situation FIP were 2008 and 2011: both under 2.1. In those years his non-save FIPS were 2.7 and 3.4. Neither was horrible, but they were both worse than his outstanding FIP in save situations. By contrast, his worst FIP years were 2000 and 2013, the only seasons in our data where he had a FIP exceeding 3.0. But in those two years his non-save FIPS were 2.8 and 3.3. One was better in non-save situations and the other was just about the same. Overall, the great Mariano was better in some years and worse in othrs in non-save situations. Sometimes he was better in FIP and worse in WHIP; other years were just the reverse. That looks a lot more like luck than a psychological block about coming in in a non-save situation. But the spread of Mariano’s results aren’t much different than anyone else’s. If Mariano was just random with respect to save and non-save situations, so was everyone else.
But I think what happens is that someone in 2003 looked at Mariano’s 0.76 WHIP in save situations and 1.4 in non-save situations and reaches for a lazy characterization of what’s going on. When the anecdote fits the stereotype, assert the stereotype. And his 2008, which is the reverse of the stereotype, hadn’t happened yet.


Implications
Managers insert closers in non-save situations because they’re trying to get them some work. Trying to get production from them is not the priority, so why does their performance in these situations matter at all? For established relievers, that’s undoubtedly correct. And for elite relievers, the ones with the biggest expected differentials, the manager really doesn’t care: he knows he’s somewhat wasting a finite asset. But his purpose is to keep his pitcher sharp. That’s probably the right thing to do (or at least it’s the right tradeoff to think about) and the somewhat lower performances by relievers in these situations is nothing to worry about, since they’re still probably better on average than the pitcher who would have been used instead. This also leads to one more hypothesis about this “effect.” It may simply come from rust. Some pitchers may perform somewhat better when a little tired… they may get some extra movement on the ball. Others may perform a little worse. That alone could explain the variability in this effect.
But I think there is an issue on the other end. How many times has a pretty good middle reliever been tried as a closer a couple of times, failed, and everyone decides that that player doesn’t have the proper psychological mindset to be a closer? Well, maybe. But maybe he was just unlucky. His expectation in save situations ought to be much closer to the larger sample size of his middle relief appearances. It may just be impatience that causes us to give up prematurely.
Batters are more fortunate. Even 100 futile at bats are often taken to mean that some minor correction to be made… and a batter has 600 or more plate appearances per season. 100 batters faced (25 innings or so) is regarded as proof that a player can’t handle closing.
In some ways, this is all like what sabermetricians have been saying about closers for quite some time. And many teams have taken that “wisdom” and tried to run a closer-by-committee strategy, with some failures but also a few clear successes like the 2022 Rays. This is one more piece of evidence that there may not be a discrete skill called “closing.” Just as we have gradually come to understand that there is no discrete skill called “clutch hitting,” it is far from certain the “closing” is a skill. This doesn’t mean that some pitchers aren’t much better than others and it certainly doesn’t mean that there may not be some players not psychologically prepared to close games. But some subset of the people we think are psychologically incapable of closing might in fact be great closers… we just didn’t have the patience to wait and see. Indeed, when Luke Jackson ended up leading the Braves with 18 saves in 2019, a position he wouldn’t have had except by front office desperation, he forms a poster child for the proposition that anybody can close if they’re good enough generally. He put up “closer” numbers and in fact performed slightly worse in non-closing situations even though he wasn’t the closer at the time. It’s not as if he wasn’t taking his non-closing appearances seriously… he just went out and pitched the best he could every time out. He was a hair luckier in his closing appearances… that’s all.
So this suggests that when you have a really great middle who fails in a few tries as a closer there may be a good case to stick with him a little longer as a closer. And, similarly, if you have a guy who looks better than his numbers in middle relief, you shouldn’t be scared to let him try closing just because closers are “different.”
If you’re still reading this and still interested, you should go read Bill James. (This is the point at which I am compelled to note that reading Bill James is almost always more entertaining and informative than anything I write; I note in my defense that I’m actually presenting new data here, and the James piece is 10 years old and talking about data from twenty years ago.) In his retrospective on what was not his Closer by Committee strategy he says:
There is a narrative about the failure of the Closer by Committee that goes like this. . .pretend you are hearing Tim McCarver. It takes a special person to handle the pressure of being The Closer. It’s one thing to get outs in the 7th inning when you’re three runs behind. It’s another thing to be out there on the mound when every man who gets on first is potentially going to cost your team the ballgame. You’re going to lose the game for your team sometimes. You have to shake it off and come back the next day and get people out. Not everybody can handle that.
To me, that argument is insulting to the players. I have known very few major league athletes who couldn’t handle the pressure of failing sometimes.
I reject that argument because I don’t like the argument, but I also reject it because I don’t think it’s generally true. It’s true sometimes. There are probably some pitchers who have difficulty with the psychological pressures of pitching constantly in game situations. I didn’t believe ten years ago, and I don’t believe now, that this is why the Closer by Committee failed.
But he then goes on to describe some things that actually do make closers different: a dsitinction he draws from the fact that closers generally have regular work and very, very few outings of more than four outs. These distinctions allow them to sprint, and sprinters are better over short distances than anyone else. It is these distinctions that have in fact led (and you can use ths piece to argue that James foresaw) to 4-5 inning starters and 20-30 bullpen games per year.
That said (and I agree with it) as long as the manager tells the closer he’s going to use him for an inning today well in advance, the game situation he comes into has nothing to do with the performance difference James is talking about here. Thus, on that logic (and assuming the closer is in fact in good communication with his manager) there is no reason to expect closers to suck in non-closing, but expected situations. The psychological explanation (the one he attributes to a Tim McCarver clone) is insulting. And it certainly doesn’t seem to be ubiquitous, or even readily attributable to any particular closer.
Future Research?
One thing I can do to extend this study is to look at it from the other side. What happens to middle relievers who are given five or six save opportunities in a year? Do they freeze up and perform badly? That’s another part of the mythos of the Closer — that guys who can close aren’t just good relievers — they have sonething extra psychologically. If people are interested, I’ll keep this going. If not, I’ll stop. Let me know in The Bar.
*[Footnote on statistical testing. If you don’t want to wade into a discussion of statistical practice, DO NOT READ.] Influenced by the great Andrew Gelman, I present no null hypothesis tests or even confidence intervals here. As Gelman says often, the null hypothesis is always false. There is absolutely no chance that closers perform exactly the same in save and non-save opportunities, so mathematically testing that hypothesis (and either rejecting it as some significance level or remaining agnostic about it because of the noisiness of the estimates) is a useless exercise. We instead employ the intraocular test of the graphs to show that the results are obviously noisy, and I promise you that the regression analysis shows the same thing.]


Recent Comments